2018 Has Been a Bust
Published On: December 26, 2018
Written by: Ben Atwater and Matt Malick
- It looks increasing likely that we are headed for a bear market, a drop of 20% or more, on a closing basis, from the S&P 500’s all-time high.
- Selling begets selling, which is what we are presently experiencing.
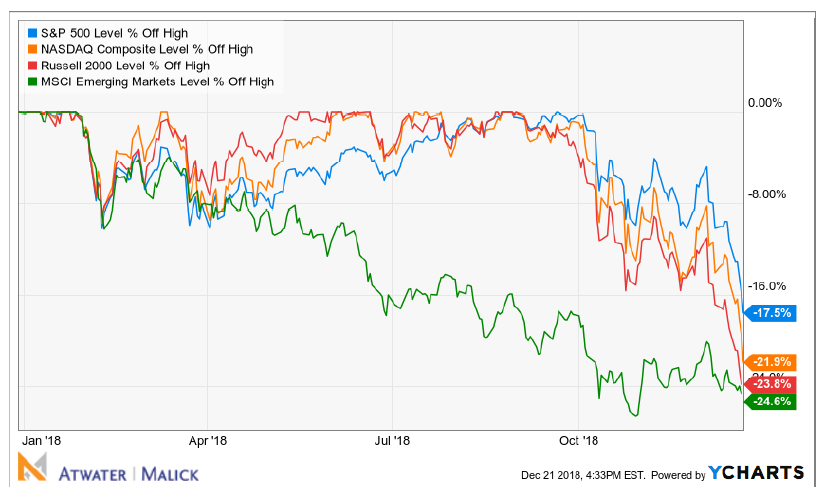
- The Nasdaq is on the cusp of a bear market, with a decline of 19.5% as of Thursday’s close.
- U.S. small cap stocks (the Russell 2000 index) are already in a bear market, off 23.8% from their highs as of Thursday’s close.
- So are emerging market stocks, as the Morgan Stanley Capital International (MSCI) Emerging Markets Index has fallen 24.6% from its highs, although they’ve outperformed domestic stocks in recent weeks.
- The S&P 500 isn’t too far behind these other equity classes with a fall of 15.8%
- What is causing this selloff? Here are the reasons we outlined in our essay from about a year ago, Thinking About 2018.
- The narrative in 2018 could change. For example, big corporate tax cuts could be the ultimate “buy on the rumor, sell on the news” trade. Sure, many of the companies we own will enjoy massive tax cuts -particularly companies with large domestic businesses. Generally, these tax cuts will lead to a one-time substantial increase in reported earnings. However, this could already be priced into stocks, we don’t know. From the perspective of 2018, tax cuts could be anticlimactic.
- Another potential change in the narrative involves fear about the structure of interest rates. Over the last six months, the yield curve has flattened tremendously. A two-year U.S. Treasury note yields 1.82% while a ten-year U.S. Treasury yields 2.349%, a difference of only 53 basis points, slightly more than half of one percent. This tells us the bond market (the larger and “smarter” market by most accounts) is hardly optimistic about future economic growth and inflation. In the past, a flattening yield curve has been an ominous sign. If it continues to flatten, and commentators decide to focus on the flattening, stocks could suffer.
- In our view, this is exactly what we are seeing now:
- The market is pricing in either peak profits or peak profit growth. At the very least, earnings can’t grow like they did in 2018 because the one-time growth rate increase from the tax cuts will be history in 2019.
- The rise in short-term interest rates, which has flattened the yield curve substantially, with the 10-Year-to-2-Year Treasury yield spread now 12 basis points, down from the 53 basis points we wrote you a year ago. As of Wednesday’s market close, the 10 Year Treasury yielded 2.77%, while the 2-year yielded 2.65%.
- What is next?
- Using monthly returns, First Trust calculates that since 1926 (when the S&P 500 began) we’ve had 9 bull markets and 8 bear markets.
- The average bull market has had a cumulative total return of 480%, while the average bear market has had a cumulative loss of 41%.
- The average bear market has lasted 1 year and 5 months, while the average bull market has lasted 9 years.
- Of the eight bear markets, four have seen losses of less than 30% and two have seen losses of more than 50%.
- Historically, bear markets are relatively quick, although extraordinary painful.
- Attempting to get in and out of the market at the right times, given the overwhelming number of positive years versus negative years, is foolhardy.
We still have absolutely no certainty that this is the beginning of a bear market. One is coming at some point, so perhaps there is no time like the present to “get it out of the way.” That said, we understand that this causes sleepless nights and we encourage you to contact us to discuss your specific investment strategy in the context of your long-term financial plan.