Every Picture Tells a Story
Published On: April 27, 2020
Written by: Ben Atwater and Matt Malick
“You can observe a lot by just watching.” – Yogi Berra
Occasionally we write you about technical analysis, the methodology of forecasting the direction of prices through the study of past market data, primarily price and volume, and often using charts. Although we never make investment decisions based solely on technical analysis, we do recognize that many traders use this tool. In this regard, chart reading can be a self-fulfilling prophesy.
Right now there is tug-of-war between investors who believe the flood of money from Congress (fiscal policy) and the Federal Reserve (monetary policy) is vast enough to spur the economy forward as it reopens (at least temporarily) over the next few months.
On the other side are the more skeptical investors who think we will pay a significant price for the economic pause, the unprecedented levels of debt, mind-blowing unemployment and the very real likelihood that the virus will resurface and force further shutdowns.
Over the past week and a half, you can see the struggle in the below chart.
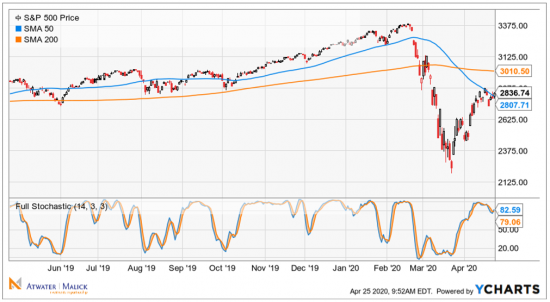
The blue line represents the S&P 500’s 50-day moving average, which is exactly what it sounds like. On Friday, the S&P 500 closed at 2836.74, just above the 2807.71 level of the 50-day. This is a pivotal point for many market technicians.
These traders are looking for a convincing break above this level to indicate a bullish direction. If a strong rally above the 50-day fails, traders would expect us to give back some of the recent gains. If a convincing break higher occurs, then traders will look to the 200-day (orange line) as the next key level for the S&P 500 at 3010.50.
None of us can be sure if the advance from the March 23rd bottom is simply a bear market rally or a new bull market. Seeing traders struggling for direction around the 50-day is evidence of this uncertainty.
On the one hand, continued gains on the back of immense Fed balance sheet expansion and fiscal deficit spending certainly seems reasonable. Then again, we can’t ignore the depression-like economic numbers rolling in every week. Predicting the short-term direction of the market, which is always a fool’s errand anyway, seems more difficult than ever. Flip a coin.
We believe the best strategy here is to be market-neutral to your long-term allocation. For those with cash to invest, now is as good of a time as any to create a disciplined plan to deploy the cash. If the market continues higher, you will make money, if the market falls again, you will be dollar-cost-averaging at lower prices. And as always, high-quality fixed income belongs in nearly every investor’s portfolio. Patience, process, and discipline are the order of the day. But aren’t they always?
During this crisis, numerous clients have asked about sharing our messages. We truly appreciate the positive feedback and would encourage you to forward these notes to family, friends and business associates. Given the current climate, we are open to adding additional recipients to our communications. If you know someone who would like to receive these essays directly, please respond and let us know.
Mar 21, 2024
Feb 27, 2024