Income and Asset Allocation
Published On: April 14, 2022
Written by: Ben Atwater and Matt Malick
Although income is always an important topic, we think recent market volatility has heightened attention to income as retirees have a continuing need to fund their lifestyles despite market woes.
Over the last few weeks, we discussed our broader portfolio income strategy, we honed in on dividends, and in our last note, we addressed interest. Today, we turn our focus to asset allocation, which, as you will see, is a key component of portfolio distributions.
When you are in portfolio withdrawal mode, it can be problematic when the market is volatile. If the market declines for a couple of years and you continue to take your fixed distribution, that distribution becomes a larger percentage of the portfolio’s diminished value, which drains the portfolio and “compounds” the problem of a down market.
During retirement you are following your financial plan and withdrawing a certain amount each year for your expenses. This amount will not decrease year over year, it will instead increase, to adjust for inflation, as costs increase.
You can see the inherent problem. The bigger the downswings in a portfolio, the more damage your distributions will do not only to the current portfolio value, but also to the portfolio’s potential to rebound in better times. Temporary portfolio volatility can prove a permanent problem.
We often measure investment risk in terms of standard deviation. For a given data set, standard deviation measures how “spread out” the returns are from an average value. By measuring the standard deviation of a portfolio’s annual rate of return, we can see how consistent the returns are over time.
The bigger the standard deviation, then the bigger the gains and the bigger the losses. In the context of portfolio withdrawals (income), big losses will hurt your portfolio value.
You need to accept enough risk (have ample portfolio volatility) to grow your retirement funds to keep up with distributions and inflation. Investing will reward us with higher returns if we have a willingness to endure volatility. However, too much volatility destroys the portfolio’s prospects when the market is down and you are withdrawing money. This is a balancing act.
A method we use to evaluate this balancing act is Monte Carlo analysis. Monte Carlo takes your spending and income and then assesses these cash flows against a wide range of simulated portfolio return sequences (the higher the standard deviation, the higher the range of portfolio returns, good and bad).
To explore the balancing act of having enough volatility to keep up with inflation, but not too much volatility to destroy a portfolio during tough times while you are living off portfolio income, we used our retirement planning software to show you a simplified analysis and find the “sweet spot” in terms of asset allocation.
We will consider Sam and Mavis Sample. They are 65 years old, and they are retiring. Our software assumes they will live until 92 and 94 years old, respectively. Therefore, they are looking to fund 27 and 29 years of retirement.
They will spend $9,646 per year on Medicare premiums, co-pays and deductibles, which will increase each year for inflation. Otherwise, to maintain their lifestyle, they will need to spend $135,000 per year, which will also grow with inflation. Both their Medicare and general expenses are after they pay all taxes.
Until they reach age 70, they will fully fund all their retirement expenses using their investment portfolios. At 70, they will begin collecting about $90,634 in Social Security (in today’s dollars as they will also receive an inflation adjustment on their Social Security).
Sam and Mavis Sample have $2,500,000 in investment assets. Each has an IRA (pre-tax) of $1,000,000 and they have a joint brokerage account (post-tax) of $500,000. They have no debt.
For this simplified scenario, these investment assets and Social Security will need to fund their retirement goals ($144,646 in total after-tax spending in today’s dollars).
Now, let us get back to standard deviation. Our mix between stocks and bonds will directly correlate with the volatility (or the risk) of the portfolio. Historically, stocks are much more volatile than bonds, but stocks return more.
To give you a sense of the numbers, the expected long-term average annual return for an all-bond portfolio in our software is 3.5% with a 6.5% standard deviation. In contrast, an all-equity portfolio has an expected average annual return of 7.44% and a standard deviation of 19.82%.
On one hand a retiree is unlikely to meet their retirement goals with a 3.5% long-term return, and on the other hand a standard deviation of 19.82% would make ongoing portfolio withdrawals a challenge. Hence the balancing act we need to master.
And this is where the Monte Carlo analysis comes into play. How do a series of random portfolio returns hold up to the spending goals and income sources of the retiree? This is where we look for the sweet spot.
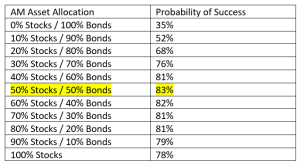
Without further ado, using our simplified case study of Sam and Mavis Sample, we can see that the sweet spot for them is a portfolio of 50% stocks and 50% bonds. The Monte Carlo analysis shows us an 83% probability of success using this stock and bond mix.
Getting the right mix of stocks and bonds is vital to producing the portfolio income you need for retirement. Dividends and interest are not sufficient to fund most people’s retirement. Instead, we need to utilize dividends, interest and capital gains. And to harvest these through a variety of market conditions, we must be aware of not only yield and total return, but also of volatility. Fitting together these pieces of the puzzle is a recipe for retirement success.
Mar 21, 2024
Feb 27, 2024