With 2019 ended and 2020 beginning, we are writing a series
about markets and the economy. The series is mainly visual, anchored with
charts, but includes brief bullet point explanations of each chart.
Throughout the series, we explore the present bull market
which commenced on March 9, 2009. Our essays to date have addressed the strong
labor market and solid consumer confidence, benign inflation and low interest
rates, unprecedented late cycle government stimulus and what’s been
interesting, even unique, about this bull market.
Today we continue with what’s been interesting about this
bull market before we ultimately analyze what threatens the bull market in 2020
and beyond. To read the previous essays in the series please visit our blog.
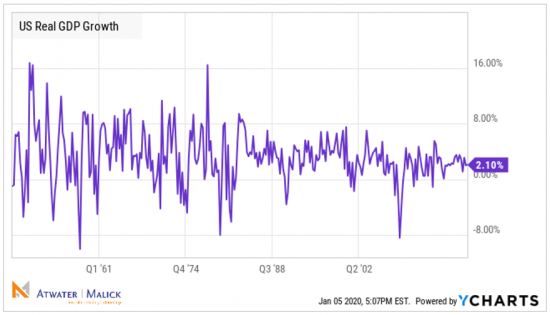
Although the present bull market has offered above-average
returns and duration, it has done so with below-trend gross domestic
product (GDP) growth.
GDP is the most common indicator to
track the overall health of the U.S. economy.
It represents the total dollar value of all goods and services produced
over a specific time period and reflects the size of the economy. The rate of GDP growth, therefore, is the rate
of growth of the economy.
Throughout the present bull market, U.S. GDP has
grown at a below-average rate of about 2% versus the long-term historical
average of about 3%.
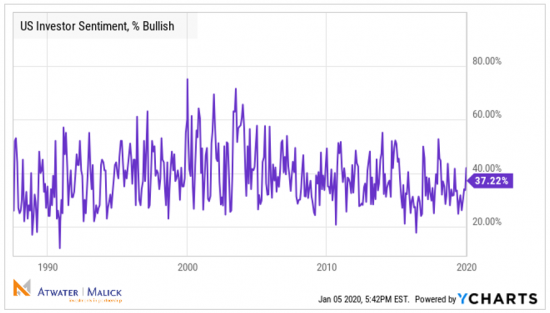
Overconfidence can be
an Achilles’ Heel for bull markets because if investors are too positive it
means that stocks are overbought and vulnerable to a correction or worse.
U.S. Investor Sentiment, Percentage Bullish, is
an indicator that is a part of the American Association of Individual Investors
(AAII) Weekly Sentiment Survey. It indicates the percentage of investors
surveyed that had a bullish outlook on the market. The most extended point of
this bullish survey was in 2000 during the technology boom. This sentiment
indicator reached 75% during that time frame.
The below-average bullish sentiment throughout
this bull market has meant that investors haven’t become overconfident like
they were in 2000. Sentiment is not a foolproof
indicator as sentiment also wasn’t extended ahead of the Financial Crisis. However, all things being equal, it is
healthier for a bull market when it climbs a wall of worry and skepticism
prevails.
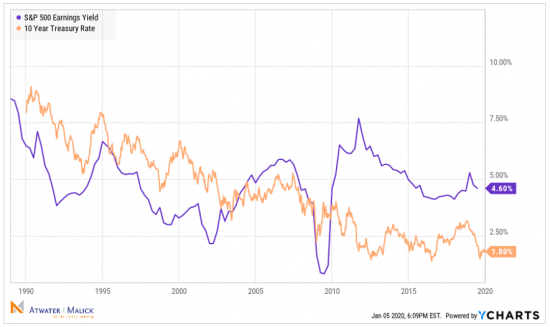
Despite below-average economic growth and little
excitement about the stock market, stocks have performed well largely for one
reason – relative value.
The earnings yield on stocks (earnings divided by
price) has far outstripped the yield on the risk-free ten-year U.S. Treasury
bond since 2010.
Primarily as a result of sustained low interest
rates, stocks have offered a better relative proposition than cash or
bonds.
It’s certainly been a bull market with lots of fascinating anomalies. Over the next couple of weeks, our final two notes will examine what might ultimately derail this bull market. We hope your 2020 is off to a great start. Please don’t hesitate to reach out to us as you contemplate your 2020 financial goals.
Intrigued? Get the Full Story.
A collection of financial essays, the Disciplined Contrarian chronicles the most serious financial crisis since the Great Depression — and the second longest bull market in modern history that followed it. Request your free copy today!