Market History
Published On: April 6, 2020
Written by: Ben Atwater and Matt Malick
History doesn’t repeat itself, but it often rhymes.
Although the present crisis is unprecedented in so many ways, a review of market history provides a guide to what we might expect going forward, for better or for worse.
Since 1929, stocks have fallen by 30% or more seven times. Although a bear market is typically defined as a drop of 20% or more, we chose the 30% threshold to focus on severe bear markets.
We are now suffering through the seventh such episode, with the S&P 500 down roughly 34% from its peak on February 19th until its low point (at least so far) on Monday, March 23rd.
With seven 30%-plus crashes over the past 90 years, stocks have experienced a severe bear market once every 12.9 years. Yet the frequency has intensified since the turn of the century with three of these crashes in just the last 20 years, which works out to one every 6.7 years.
The chart below details each of these severe bear markets. (Because the S&P 500 wasn’t created until 1957, we used the Dow Jones Industrial Average for the Great Depression crash and the S&P 500 for the next six periods.)
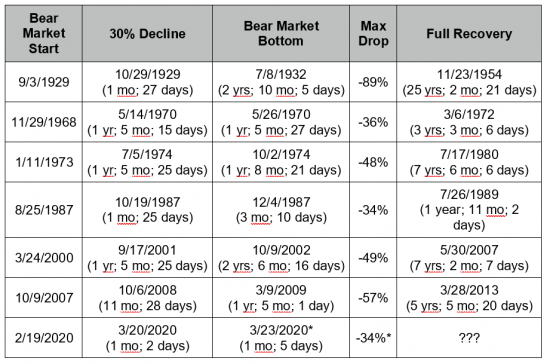
* The 2020 bear market bottom and peak-to-trough decline represent the low point so far and history can only confirm after the S&P 500 makes a full recovery.
Although each bear market has been unique, they seem to fall into three main categories:
The Great Depression
The Great Depression deserves a category all its own. In the fall of 1929, a spectacular stock market bubble burst and stocks fell by 30% in less than two months. Stocks didn’t hit a bottom for nearly three years, ultimately falling by a whopping 89%. Perhaps most disconcerting of all, the Dow didn’t return to its 1929 level until 1954, more than 25 years later.
If there are similarities between the Great Depression and the current virus-induced episode, it’s the speed of the 30% decline (each took less than two months) and the severity of the economic damage. U.S. GDP contracted by over 25% during the Depression and today our economy has ground to a screeching halt.
The differences though are vitally important. First, major currencies around the world were tied to a gold standard amidst the 1929 crash. Central banks attempted to maintain that standard rather than expanding the money supply. In recent weeks, the U.S. Federal Reserve and central banks around the world have taken unprecedented actions in order to drive down interest rates, bolster asset prices and provide liquidity to markets.
Second, the federal government ran a fiscal surplus from 1929-1931 rather than boosting government spending to offset shrinking private economic activity. In 2020, on the other hand, the U.S. will run an annualized budget deficit of at least $3 trillion and possibly much more if Congress passes another stimulus bill. The fiscal deficit could ultimately reach 20% of gross domestic product.
Anything is possible, but a second Great Depression seems unlikely given the lessons economists and governments learned from the 1930s. As contrarian investors, the mere fact that so many pundits are now drawing comparisons to the Great Depression gives us added comfort.
One-Half Declines
On three occasions – 1973, 2000 and 2007 – stocks entered bear markets that wiped out roughly half of the S&P 500 index’s value. Each took significantly longer to reach the 30% threshold than the 2020 bear market has. And each took well over a year to hit bottom.
The causes were disparate. From 1973-74, stocks fell due to an oil crisis, surging inflation and economic stagnation. The 2000-02 bear market started with the dot.com crash followed by the 9/11 terrorist attacks. And a housing market crash and financial crisis caused the 2007-09 bear market.
Much like our current dilemma, all three were serious economic shocks. Only time will tell if the present bear market falls to similar levels.
One-Third Declines
The other two severe bear markets, in 1968 and 1987, lost roughly a third of their value. Aside from hitting a bottom at a mid-30% decline, they had little else in common.
The 1968-70 bear market coincided with rising inflation, restrictive monetary policy and preceded a mild recession. Much like some of the deeper bear markets above, it took over a year for stocks to hit bottom and several years to recover to their previous highs.
On Monday, October 19, 1987, the stock market crashed, suddenly and unexpectedly, with the Dow tumbling 22.6% in one day. “Black Monday” remains the worst single day drop in U.S. history and investors debate the causes of the crash to this day. Stocks hit bottom shortly thereafter in December of 1987. The market only took three months to reach its low point but, even in this case, it took nearly two years to fully recover to the 1987 highs.
The 2020 Bear Market
The causes of the “one-third declines” pale in comparison to the economic disruption and the general sense of terror that COVID-19 is generating. On the other hand, a second Great Depression seems unlikely given measures the government is taking and the probability that modern medicine will ultimately address the virus. Given the gravity of our current predicament, which is at least on par with the crises in 1973, 2000 and 2007, another bear market of the one-half variety seems a possibility.
But nobody really knows how deep this bear will go or how long it will persist. Our best guess is that stocks will reach new lows long before they again reach their February highs. But this is only the suspicion of two chronic skeptics.
In our minds, severe bear market history offers three firm conclusions.
First, severe bear markets last a long time.
Even excluding the Great Depression, they have lasted anywhere from two to seven years. Therefore, it’s crucial to maintain an appropriate asset allocation in your portfolio, particularly if you’re making ongoing withdrawals to support your income. By maintaining an allocation that suits your time horizon and risk tolerance, which we’ve helped clients do by actively rebalancing from stocks to bonds in recent years, you’re better prepared to “wait out” a long bear market.
Second, stocks still offer above-average long-term returns to patient investors.
Despite suffering three severe bear markets over the last two decades, much more frequently than in prior decades, stocks have still been a decent investment if investors avoided mistakes along the way.
If an investor (with horrible luck) bought the S&P 500 at the peak on March 24, 2000, then maintained his investment through the recent bottom on March 23rd, which happened to be 20 years to the day, he still would have earned 3.93% per year. To be clear, sub-4% equity returns are nothing to write home about. But they did outpace inflation by a wide margin. Coupled with an allocation to fixed income and rebalanced periodically, an actively managed portfolio could have done better.
Third, dividends are critical.
If we exclude dividends, the rate of return over this 20-year period drops to just 1.93% per year. This would have trailed even the rate of inflation. Dividends represented more than half of equity returns over this stretch, a trend that investors have noted across stock market history.
Throughout many market cycles, stocks have delivered robust long-term returns. But if you tried to time the market, if you failed to rebalance your portfolio and if you didn’t focus on dividends, then you didn’t do well. These are three themes where history is likely to repeat itself.
Mar 21, 2024
Feb 27, 2024