Risk, Return & Retirement
Published On: September 10, 2018
Written by: Ben Atwater and Matt Malick
Why does Harvard invest its endowment? To provide a consistent payout to help fund the University’s operations. Why does the California Public Employees Retirement System (CalPERS) invest? To provide monthly pension income to its millions of members. Why do most individuals invest? To create a funding stream to help cover retirement expenses.
These investors all have a common goal. They aim to create a framework for risk-adjusted returns to meet specific spending goals.
A few weeks ago, we wrote about spending in retirement. This essay picks up on the idea that, although spending and saving are integral to retirement planning, you cannot ignore investing. More specifically, you must pay attention to the risk associated with investing. After all, if markets fall substantially during your retirement (and they are bound to do so at least once or twice), it’s more difficult to recoup losses because money is flowing out of your portfolio (to cover expenses). This contrasts with those in their saving years who can often benefit from a fall in markets, especially young savers who stick to their allocations and dollar-cost-average.
For those around retirement age, it is helpful to estimate the most conservative allocation whereby you can still reach your retirement goals.
In the tables below, we are testing various asset allocations using different return sets, actual and hypothetical. In the first table, we use returns that actually occurred in markets from 1970 through 2017. In the second table, we use a set of capital market assumptions (anticipated future returns), that are lower than what has been the case historically, both in terms of nominal returns and “real” inflation-adjusted returns. We much prefer using actual historical returns because markets are unpredictable and guessing at what the future holds seems nonsensical. We’d rather use what history has already shown us.
Furthermore, MoneyGuidePro (our financial planning software) provides us the ability to run a Monte Carlo Analysis. This is a statistical process of evaluating the probability of different outcomes by randomly selecting historical market returns. This is in contrast with capital market assumptions where Monte Carlo Analysis employs an anticipated return combined with an anticipated standard deviation, a statistical measure of risk that the software applies to quantify the amount of variation around the returns.
The Monte Carlo Analysis estimates a “probability of success.” This is the percentage of projected market scenarios in which you succeed in meeting your goals.
Let us now see how these various returns worked in a hypothetical client situation using MoneyGuidePro at various stock and bond mixes.
Mr. and Mrs. Client are 65 years old and recently retired, they each have $500,000 Rollover IRAs and a $500,000 joint brokerage account. Their combined Social Security at Full Retirement Age is about $50,000 per year and their annual after-tax spending before healthcare is $90,000. Finally, all of their various Medicare-related premiums and out-of-pocket expenses cost $10,671 annually. (All in today’s dollars.)
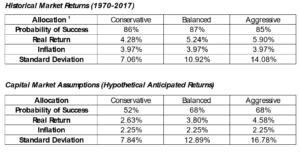
As you can see in these results, the capital market assumptions are significantly less optimistic than the historical returns, assuming a future of lower returns and higher risk (higher standard deviation). Although we aren’t optimistic at this juncture of the business cycle, we think the historical real returns are pragmatic, especially over a 20 to 30-year time horizon.
In this context, your investment goal is to earn the rate of return you need to meet your retirement goals, plus inflation. Which, brings us back to the analogy of the Harvard Endowment and CalPERS Pension who also have highly specific investments goals. More than ever, we need to focus our time, attention and discipline on examining and defining your actual risk-adjusted investment goals. A retirement plan needs to serve as your investment road map.
[1] Conservative – 35% equities /65% bonds; Balanced – 65% equities /35% bonds; Aggressive – 85% equities /15% bonds
Please visit www.atwatermalick.com/ria for full disclosure materials related to recommendations contained in this update.
Mar 21, 2024
Feb 27, 2024